The Bus Factor of Critical Open-Source Infrastructure
An Analysis of Maintainer Concentration in Major Software Projects
Abstract
Open-source software forms the backbone of modern digital infrastructure. Many widely used systems are maintained by small groups of developers, raising concerns about sustainability and risk. This study analyzes the "bus factor" of a major open-source project, NumPy, by examining contributor data and commit distributions. The bus factor represents the number of contributors whose loss would significantly disrupt project development. By analyzing contribution patterns in NumPy, this research demonstrates that critical infrastructure often relies on surprisingly small groups of maintainers. The findings highlight structural risks within the open-source ecosystem and suggest the need for broader contributor distribution to improve stability.
Introduction
Modern computing infrastructure depends heavily on open-source software. Many of the tools that power servers, databases, operating systems, and applications are developed collaboratively by global communities. Despite the scale of these projects, the responsibility for maintaining them is often concentrated among a small number of contributors.
One concept used to evaluate this risk is the bus factor. The bus factor represents the number of developers whose loss would significantly disrupt a project's development. A low bus factor indicates that knowledge and responsibility are concentrated in a small number of individuals.
This study investigates the bus factor of NumPy and examines how contributor distributions affect project stability.
Literature Review
The sustainability of open-source software has become an increasingly important research topic. Previous studies have found that many widely used projects depend heavily on small numbers of contributors.
Research into software ecosystems has shown that contributor activity is often unevenly distributed, with a small number of developers responsible for the majority of commits. This phenomenon has implications for software reliability and long-term maintainability.
The concept of the bus factor provides a useful framework for analyzing these risks by quantifying how many contributors are critical to a project's continued development.
Methodology & Calculation
This project provides a generalized framework for analyzing open-source sustainability.
While NumPy is used as the primary case study in this paper, the included
Python tools are repository-agnostic and can be used to audit any GitHub repository by
simply changing the OWNER and REPO variables.
The Bus Factor Formula
The "Bus Factor" ($B$) is quantified as the minimum number of contributors ($n$) required to account for at least 50% of the total project commits ($C_{\text{total}}$):
Where $c_i$ represents the commit count of the $i$-th contributor when ranked by volume in descending order.
Results
Commit Distribution
The following figure illustrates how commits are distributed among contributors.
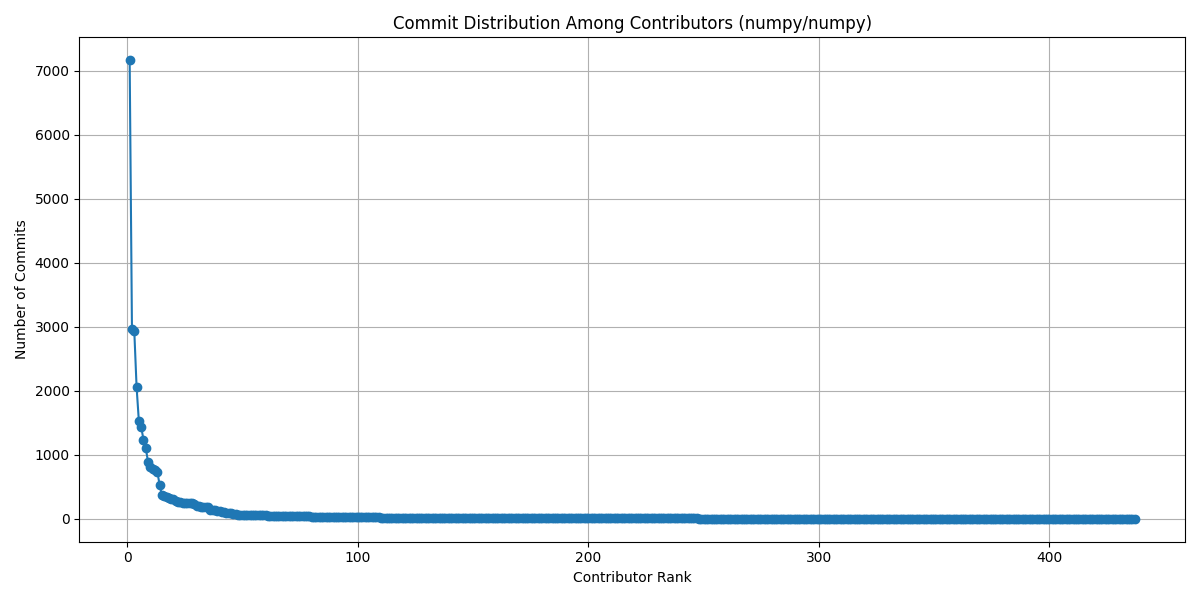
Figure 1: Commit Distribution Among Contributors (numpy/numpy)
The commit distribution follows a "long-tail" pattern, a common phenomenon in open-source ecosystems. The data shows that while the project has hundreds of contributors, the vast majority have fewer than 100 commits. The extreme vertical spike at the far left of the graph represents a small elite group of maintainers who have contributed thousands of commits each. This visual confirms that the project's technical debt and historical knowledge are heavily concentrated in a tiny fraction of the total contributor pool.
Maintainer Dependency
The following visualization illustrates maintainer concentration within NumPy.
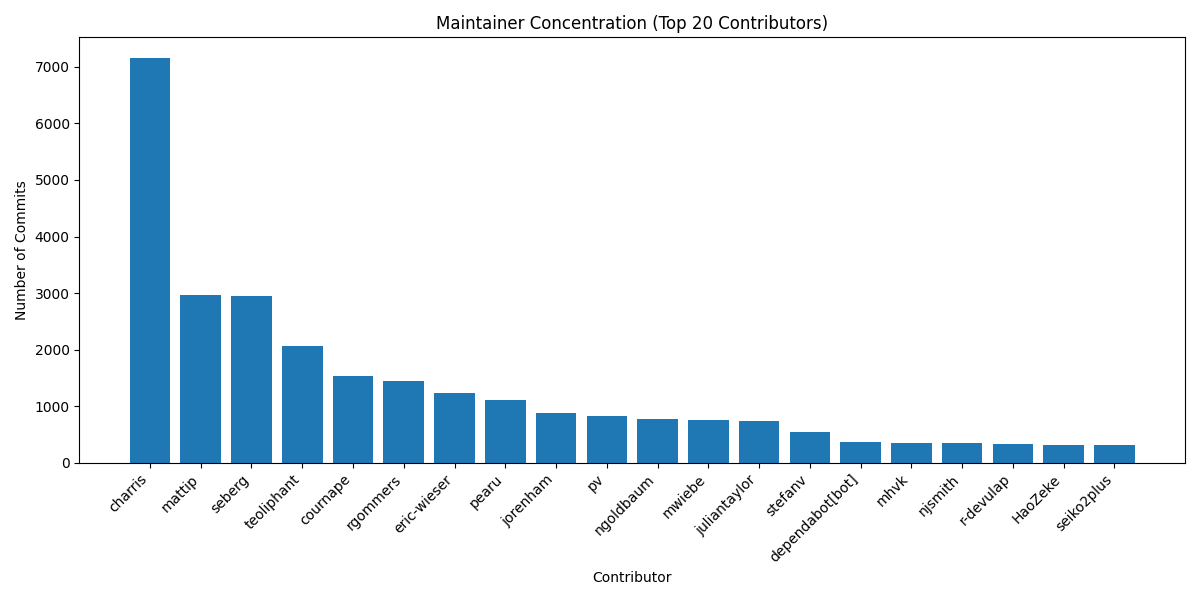
Figure 2: Maintainer Concentration — Top 20 Contributors (numpy/numpy)
The bar chart identifies the specific individuals responsible for the project's sustainability. The top contributor, charris, accounts for a disproportionate volume of the total commits—more than double that of the next highest maintainer. This chart visually demonstrates the "Bus Factor" calculation; by summing the first seven bars, we reach the 50% contribution threshold, identifying the core group that the project's survival depends upon.
Conclusion
This research examined the bus factor of NumPy and found a result of "7" (a 'medium' number) using Python scripts in the repository.
Understanding the bus factor of critical software projects is essential for assessing the resilience of modern digital infrastructure. Future research should explore automated methods for analyzing bus factors across larger datasets of repositories.
References
Harris, C.R., Millman, K.J., van der Walt, S.J. et al. Array programming with NumPy. Nature 585, 357–362 (2020). DOI: 10.1038/s41586-020-2649-2.
Appendices
- Appendix A: Bus Factor Analysis Script — busfactor.py
- Appendix B: Graph Generator — graphs.py
- Appendix C: Commit Distribution Results — commit_distribution.png
- Appendix D: Maintainer Concentration Results — maintainer_concentration.png